I have been looking at ways to combine overlapping meshes which come from different sets of photographs. These sections are meshed in Meshlab from point clouds derived from Photosynth. Here is the procedure I am using, values in square brackets are aproximate may change depending on the data:
- Import Photosynth data
- Compute normals for point sets [Number of neigbors: 20]
- Surface Reconstrution: Poisson [Octree Depth: 14]
- Subdivision Surfaces: LS3 Loop [Iterations: 3]
- Subdivision Surfaces: Catmull-Clark
- Vertex Attribute Transfer: [From point set: Color, Normal, Geometry]
- Remove Duplicate Vertex
- Select Faces with edges longer than... [Edge Threshold: 0.05]
The results look something like this:
To combine two or more distinct overlapping meshes I use Meshlab's Iterative Closest Point alignment tool to find a best fit:
Once the meshes are combined the above process can be repeated to create one seamless mesh like so:
Now to repeat this process for each of the sections to try and achieve even coverage across the site. A long way still to go...
Tuesday, 31 January 2012
Saturday, 21 January 2012
Saucel Hill Survey
These are the results of a pleasant afternoon kite flying at Saucel Hill in Paisley, a site of interest to a group of Archaeologists who would like to investigate apparent features on the hill. I met with Ellie McCulloch, Claire Casey and Kevin Grant to photograph the site.
At around 300m long by 150m wide the site is by far the largest I've ever tied to photograph for photogrammetry. We started by setting up a vertical plumbline from a tree with two markers, one directly above the other. The wind clearly reduced the acuracy of this theory although if this can be solved the resulting points did work well for aligning the 3D data to the vertical. These markers are visible as a white dot on the colour image below.
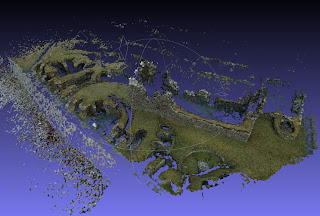
The results were hampered by increasingly light winds and dull light conditions and in the end I only managed to get limited coverage for a small section of the hill. Despite this the images below demonstrate faint rig and furrow marks on the left hand side which show up in both colour and topography.
This mesh was generated using Poisson reconstruction within Meshlab of a point cloud created in Photosynth. The orthographic colour image was created by mapping the point colours onto the mesh, a technique which I hadn't tried before. This is clearly useless in areas where there are few points although it provides nicely even colour data where the points are dense.
The rig and furrow marks appear to run right across the top of the hill, although the lack of data in the centre makes it hard to see the full extent. The image below maps out the areas of high and low resolution, light green representing dense (good) data.
For the most part I'm unsatisfied by these results and am keen to return to the site to capture more data. Lesson's learned include:
Thanks again to Ellie, Claire and Kevin for introducing me to the site and providing much worldly insight into matters archaeological . Until next time.
At around 300m long by 150m wide the site is by far the largest I've ever tied to photograph for photogrammetry. We started by setting up a vertical plumbline from a tree with two markers, one directly above the other. The wind clearly reduced the acuracy of this theory although if this can be solved the resulting points did work well for aligning the 3D data to the vertical. These markers are visible as a white dot on the colour image below.
The results were hampered by increasingly light winds and dull light conditions and in the end I only managed to get limited coverage for a small section of the hill. Despite this the images below demonstrate faint rig and furrow marks on the left hand side which show up in both colour and topography.
This mesh was generated using Poisson reconstruction within Meshlab of a point cloud created in Photosynth. The orthographic colour image was created by mapping the point colours onto the mesh, a technique which I hadn't tried before. This is clearly useless in areas where there are few points although it provides nicely even colour data where the points are dense.
The rig and furrow marks appear to run right across the top of the hill, although the lack of data in the centre makes it hard to see the full extent. The image below maps out the areas of high and low resolution, light green representing dense (good) data.
For the most part I'm unsatisfied by these results and am keen to return to the site to capture more data. Lesson's learned include:
• More hours of daylight are required to capture such a large scale site. Best aim for as much light as possible to avoid blur.
• Further planning of the coverage route would be useful particularly where there are few landmarks to keep track of my position on the ground. I may try using a handheld gps on large sites like this in the future.
• Where even coverage is required take into account that walking up and down alters the line angle when the winds are light. I'd perhaps consider using a slightly larger kite the necessary in future situations like this.
• As always triple check settings before launch (d'oh).
Thanks again to Ellie, Claire and Kevin for introducing me to the site and providing much worldly insight into matters archaeological . Until next time.
Sunday, 15 January 2012
Jarlshof Photogrammetry in Progress
With over 5,000 still photographs taken at Jarlshof just for photogrammetry, I am currently left with the task of selecting sequences which will resolve into good 3D data. I'm approaching the site one section at a time to create overlapping pieces of geometry which can be patched together later.
Above is an orthographic top-down view of a point cloud centered around the Broch and Laird's House. You can see the continuation of the curved Broch wall on the inside of the ruined house. I found the geometric precision of the circular Broch quite striking from the top-down view. Large areas of shadow, particular on the upper side of the broch, show that this section will need more photographs added for better coverage.
This geometry was a test of how sections can be aligned using tools within Meshlab, and then re-surfaced to create one piece of geometry. The coverage and precision here are fairly poor. To some extent I hope to improve upon these results through further and better photograph selection and more careful meshing. Results will be limited by the captured sequence however and already there are many lessons to be learned in terms of angle of view and density of coverage when capturing photographs.
Subscribe to:
Posts (Atom)